Applied Geospatial Analytics
Welcome to ISSS624 Applied Geospatial Analytics!
On this webpage, I am going to share my learning journey on geospatial analytics. This involves the transformation, manipulation and application of analytical methods to spatial (geographic) data.
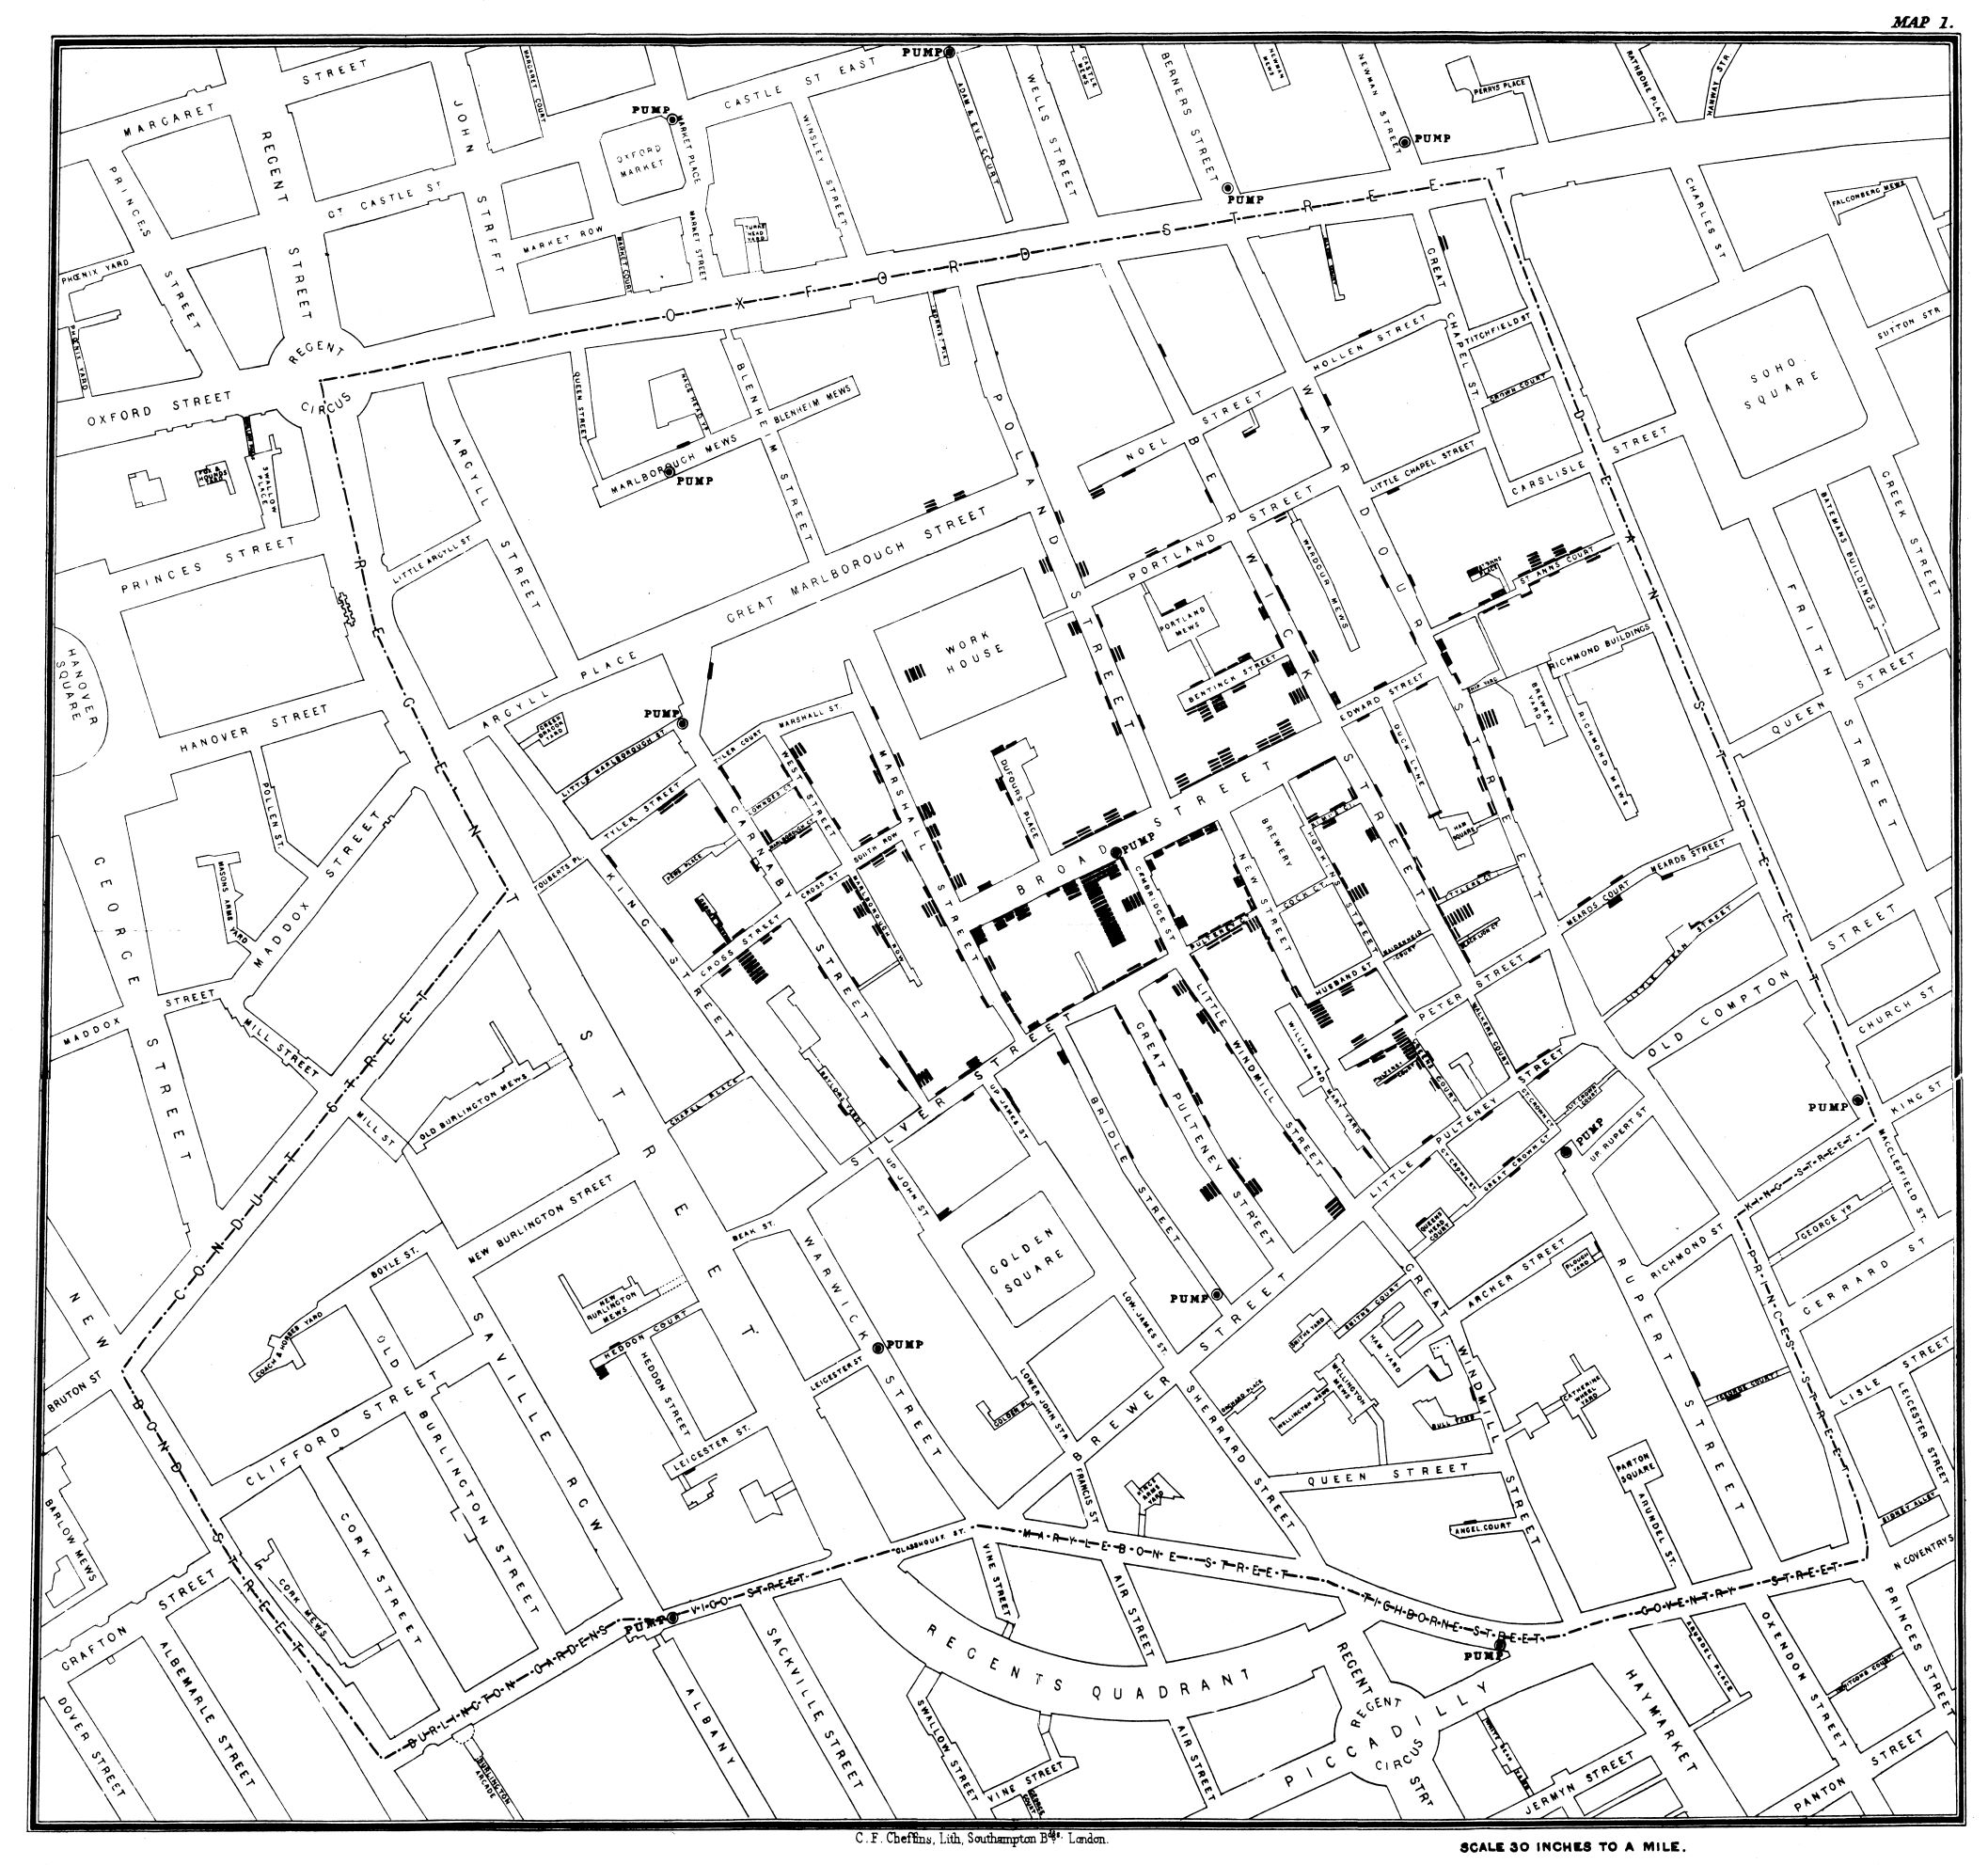
The power of geospatial analysis is best exemplified by Dr. John Snow (15 March 1813 – 16 June 1858), an English physician in the development of anesthesia and medical hygiene. While investigating the Cholera outbreak in London in 1854, Snow used a dot map (see below) to represent the cluster of cholera cases around a pump which was the source of sewage-contaminated water.

He also used statistics to illustrate the connection between the quality of the water source and cholera cases. He showed that homes supplied by the Southwark and Vauxhall Waterworks Company, which was taking water from sewage-polluted sections of the Thames, had a cholera rate 14 times that of those supplied by Lambeth Waterworks Company, which obtained water from the upriver, cleaner Seething Wells. These supported his chemical and microscopic examination of the water collected from the pump was hazardous and convinced the local council to disable the well pump. This action was commonly credited as ending the Cholera outbreak.
Snow’s study was a major event in the history of public health and geography
(Source: John Snow - Wikipedia)